Performance
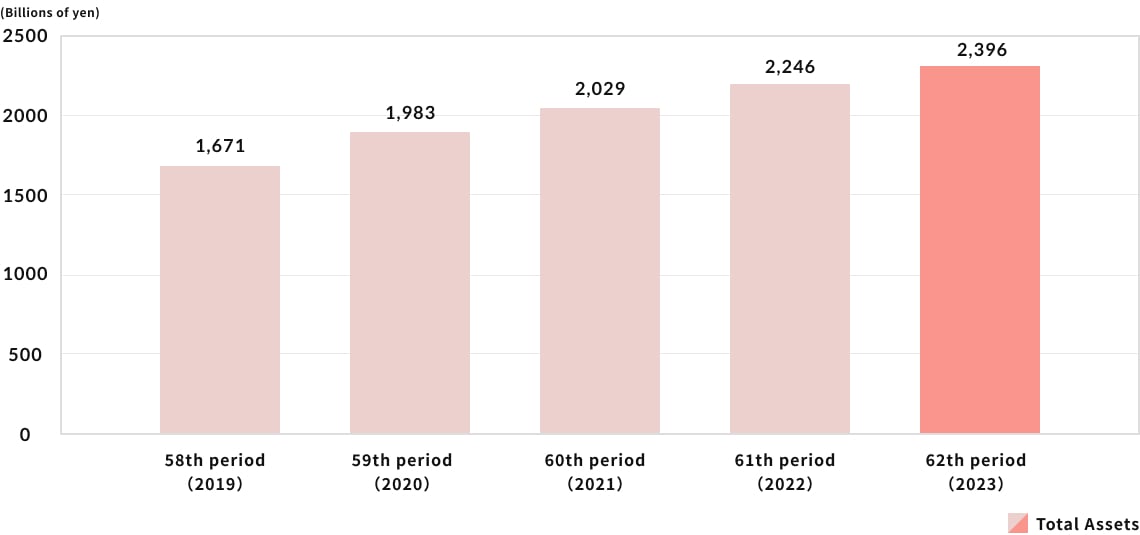
Group Total Assets:670 billion yen(including Fukuoka REIT Corporation and FJ Private REIT Corporation)
※Calculated based on the market value at the end of each company's fiscal period.
| 60th period, ending FY May 2021 |
61th period, ending FY May 2022 |
62th period, ending FY May 2023 |
63th period, ending FY May 2024 |
64th period, ending FY May 2025 |
|
|---|---|---|---|---|---|
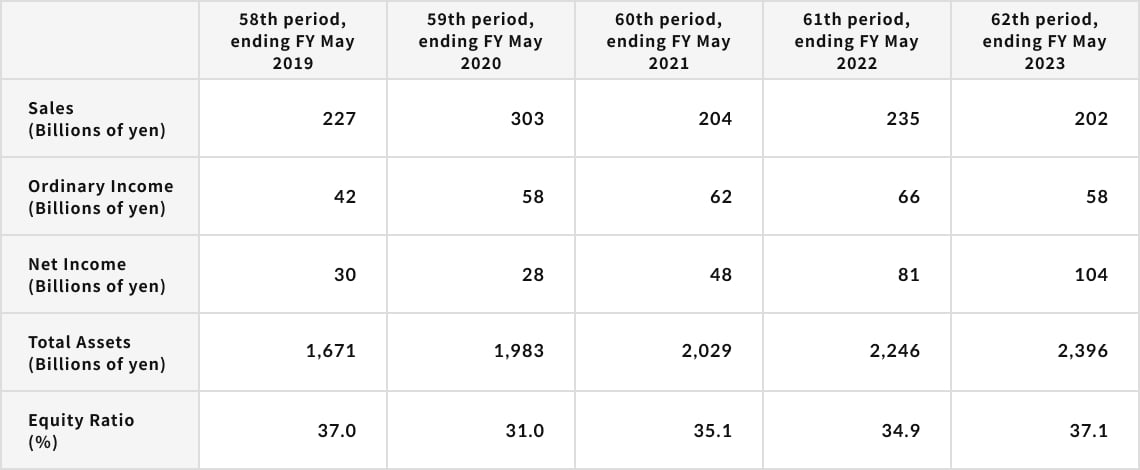
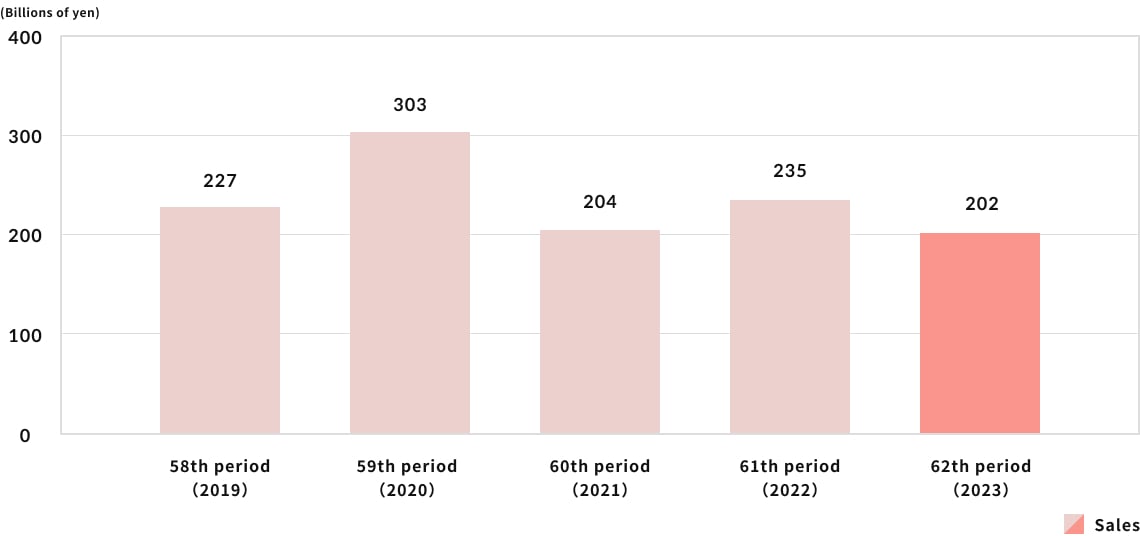
| Sales(100 million yen) | 204 | 235 | 202 | 253 | 207 |
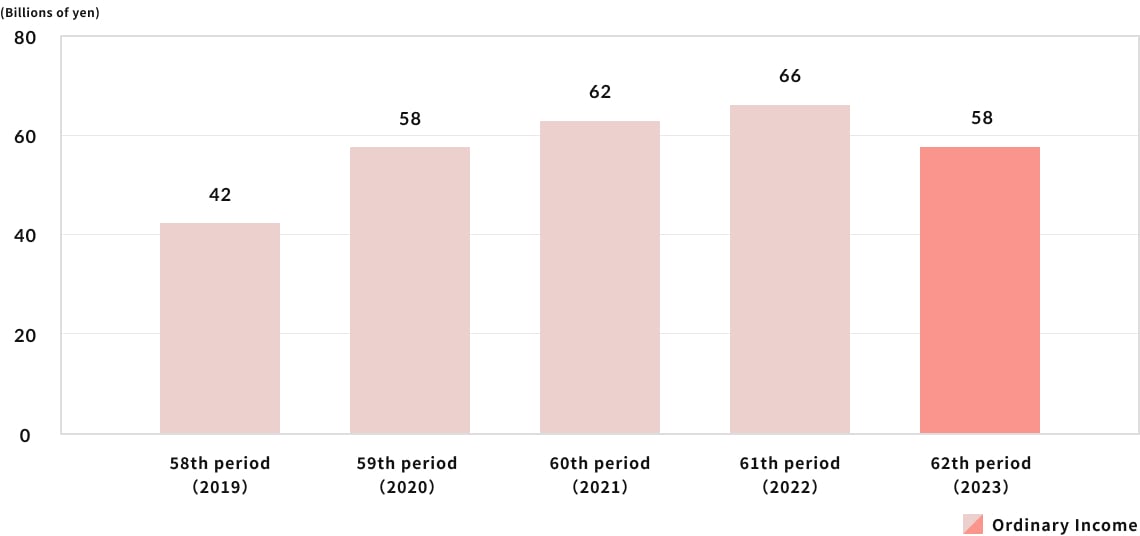
| Ordinary Income(100 million yen) | 62 | 66 | 58 | 137 | 70 |
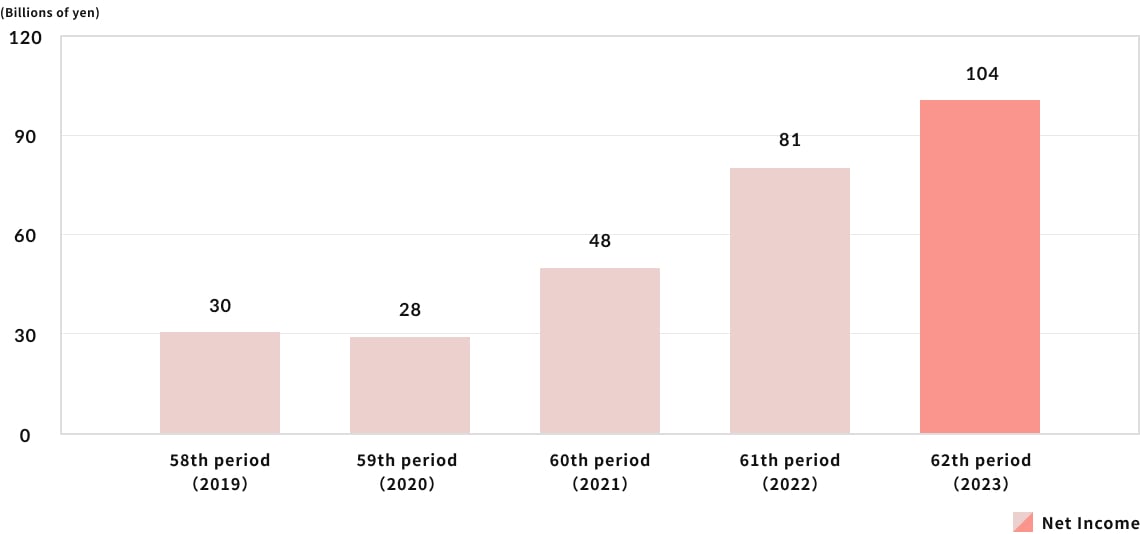
| Net Income(100 million yen) | 48 | 81 | 104 | 94 | 63 |
| Total Assets(100 million yen) | 2,029 | 2,246 | 2,396 | 2,659 | 2,664 |
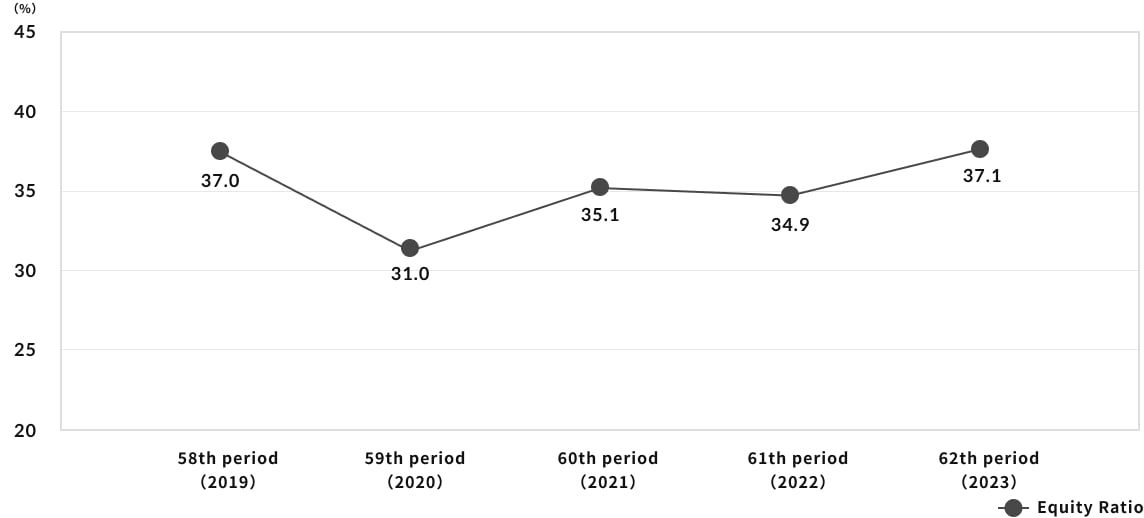
| Equity Ratio(%) | 35 | 35 | 37 | 38 | 40 |
